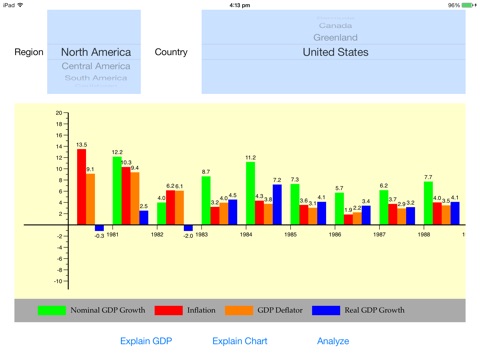
GDP Chart app for iPhone and iPad
Developer: FunStudyo Inc
First release : 16 Oct 2013
App size: 1.06 Mb
GDP Chart helps you analyse the GDP Growth rate of countries and regions around the world. The data for this app is taken from the World Bank. There are about 216 countries and 36 country-groups which you can choose from.
Pick a region and then pick a country. The chart will display the GDP growth rate from 1980 to 2012. GDP Growth Rate gives an indicator of how good you feel about the economy. GDP Growth Rate is adjusted for inflation and currency fluctuations. In the years of high inflation, you feel uneasy about the economy, even though the growth rate may be good.
The Analyze button at the bottom gives more information: Nominal GDP Growth Averaged, Real GDP Growth Averaged, and Years where there was negative GDP Growth.


